STEP #22 - Un manuale d'uso
La macchina Atwood è un dispositivo di laboratorio di fisica di base, spesso utilizzato per dimostrare i principi di base della dinamica e dell'accelerazione.
Per prima cosa è necessario assemblare lo strumento (in questo caso è stata scelta la macchina prodotta da PASCO utilizzando il relativo software di calcolo):
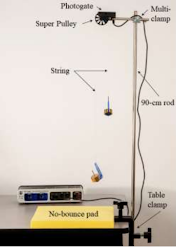 |
| Figura 1: configurazione della macchina di Atwood |
 |
| Figura 2: Puleggia e Photogate |
 |
| Figura 3: aste e morsetto |
1. Fissare il morsetto da tavolo e l'asta da 90 cm al bordo del tavolo come mostrato in figura 1
2. Attaccare la puleggia al photogate usando l'asta di montaggio come mostrato nella Figura 2. Potrebbe essere necessario rimuovere prima la puleggia dal proprio morsetto.
3. Utilizzare il multi-morsetto (vedere la Figura 3) per fissare il photogate all'asta verticale.
4. Collega il cavo del photogate all'ingresso digitale # 1 dell'interfaccia universale 550.
5. Posizionare il pad antirimbalzo giallo (vedere Figura 1) sotto il photogate da proteggere il gancio di massa che cade quando raggiunge la tavola.
6. Taglia un pezzo di spago da 1,2 m e fai dei passanti su ciascuna estremità per tenere un gancio di massa. Passaggio la corda su e sopra la puleggia come mostrato nella figura 3.
7. Aggiungere una singola massa da 100 ge una singola massa da 20 g a un gancio di massa (5 g) per una massa totale di 125 g, che sarà massa m1. A un secondo gancio di massa aggiungere una singola massa da 100 g per a totale di 105 g, che sarà massa m2. Appendi le masse sulla corda sopra la carrucola.
8. Regola l'altezza della puleggia o la lunghezza della corda in modo che quando un gancio di massa è toccando il pad antirimbalzo, l'altro mass hanger si trova pochi centimetri sotto la carrucola. Assicurati anche che il photogate sia orizzontale in modo che la corda non tira affatto lateralmente la carrucola.
9. In Capstone, apri Impostazione timer nella barra degli strumenti a sinistra. Scegli un timer preconfigurato per photogate nel canale 1. Selezionare un photogate con carrucola come tipo di timer e selezionare Posizione e velocità lineare come misure che saranno visibili. La lunghezza dell'arco dei raggi è 0,015 me l'angolo del raggio è di 36 gradi.
10. Nella barra degli strumenti inferiore, apri Condizioni di registrazione. Impostare una condizione di arresto come misurazione in base alla posizione (in metri) superiore a 0,30. Più tardi durante le misurazioni, questa condizione lo farà fa sì che la registrazione si interrompa automaticamente una volta che le masse si sono spostate di 0,30 m. Puoi modificare questa condizione se necessario per adattarla al tuo esperimento.
PROCEDURA
1. In Capstone, crea un grafico di Velocità lineare rispetto al tempo.
2. Spostare m2 nel punto più basso. Fare clic su Registra, rilasciare m2, quindi interrompere solo la registrazione prima che m1 colpisca il pad.
3. Le masse possono toccarsi mentre si incrociano. In tal caso, ripetere la corsa. Puoi eliminare corse indesiderate utilizzando la funzione Elimina esecuzione nella barra degli strumenti inferiore. Dovresti vedere un lineare
regione sul grafico della velocità mentre le masse si muovono liberamente.
4. Attivare Adattamento curva sulla barra degli strumenti del grafico e selezionare Adattamento ineare. Qual è il fisico significato della pendenza della linea?
5. Registrare il valore misurato dell'accelerazione, comprese le unità.
6. Utilizzando l'equazione 3, calcolare il valore teorico dell'accelerazione.
7. Calcola l'errore percentuale per l'accelerazione:
ENGLISH VERSION:
The Atwood machine is a basic physics laboratory device often used to demonstrate the basic principles of dynamics and acceleration.
First of all it is necessary to assemble the instrument (in this case the machine produced by PASCO was chosen using the relative calculation software):
1. Fasten the table clamp and the 90-cm rod to the edge of the table as shown in Figure 1.
2. Attach the pulley to the photogate using the mounting rod as shown in Figure 2. The pulley may need to be first removed from its own clamp.
3. Use the multi-clamp (see Figure 3) to fasten the photogate to the vertical rod.
4. Plug the photogate cord into Digital Input #1 of the 550 Universal Interface.
5. Position the yellow no-bounce pad (see Figure 1) below the photogate to protect the falling mass hanger when it reaches the table.
6. Cut a 1.2 m piece of string and tie loops on each end to hold a mass hanger. Pass the string up and over the pulley as shown in Figure 3.
7. Add a single 100-g mass and a single 20-g mass to one mass hanger (5 g) for a total mass of 125 g, which will be mass m1. To a second mass hanger add a single 100-g mass for a total of 105 g, which will be mass m2. Hang the masses on the string over the pulley.
8. Adjust the height of the pulley or length of string so that when one mass hanger is touching the no-bounce pad, the other mass hanger is a few centimeters below the pulley. Also make sure the photogate is horizontal so the string does not pull sideways at all on the pulley.
9. In Capstone, open Timer Setup in the left toolbar. Choose a pre-configured timer for the photogate in channel 1. Select a photogate with pulley as the type of timer, and select Position and Linear Speed as measurements that will be visible. The spoke arc length is 0.015 m and the spoke angle is 36 degrees.
10. In the lower toolbar, open Recording Conditions. Set a Stop condition to be measurement based for Position (in meters) above 0.30. Later during measurements, this condition will cause recording to stop automatically once the masses have moved 0.30 m. You can adjust this condition if needed to suit your experiment.
PROCEDURE
1. In Capstone, create a graph of Linear Speed vs. Time.
2. Move m2 to its lowest point. Click on Record, release m2, and then Stop recording just before m1 strikes the pad.
3. The masses may touch as they pass each other. If so, repeat the run. You can delete unwanted runs using the Delete Run feature in lower toolbar. You should see a linear region on the speed graph as the masses move freely.
4. Turn on Curve Fit on the graph toolbar and select Linear fit. What is the physical meaning of the slope of the line?
5. Record the measured value of the acceleration, including units.
6. Using Equation 3, calculate the theoretical value for the acceleration.
7. Calculate the percent error for the acceleration:
sitografia:
https://d2n0lz049icia2.cloudfront.net/product_document/Atwoods-Machine-Manual-SA-9241.pdf
hydrogen.physik.uni-wuppertal.de/hyperphysics/hyperphysics/hbase/atwd.html
Commenti
Posta un commento